TL; DR
You can display SonarQube static analysis results live in Visual Studio error and information console using the same rules set as the SonarQube project.
Installing the extension
Just go to https://www.sonarlint.org/VisualStudio/index.html and proceed with the installation.
Binding the Visual Studio solution to the SonarQube analysis
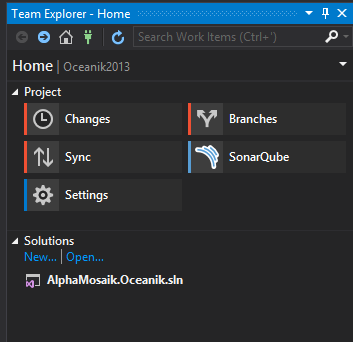
From the Team Explorer click SonarQube
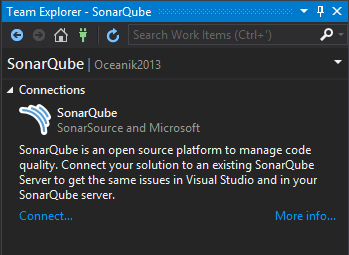
Click on connect.
(if you obtain a certificate error, you must install the self-signed certificate of the SonarQube server on your machine)
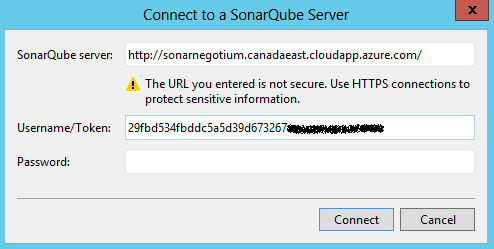
To generate a personal access token, refer to the following documentation https://docs.SonarQube.org/display/SONAR/User+Token
Enter the token in the SonarQube login prompt as well as the server url
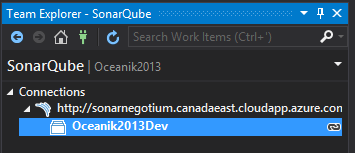
Double click on the SonarQube project that you want to bind to the Visual Studio solution
The errors detected by SonarQube static analysis now show up as a warning in the error console as well as in the intellisense.
JavaScripts Projects
There are cases where you’ll be only working on JavaScript/TypeScript using an editor lighter than the full version of Visual Studio, for example Visual Studio code. With SonarQube, the static analysis for JavaScripts projects, primarily relies on ESlint and TSlint. To have static analysis work from within your code editor, you only need to install the corresponding extensions and add a few configuration files in your source base.
If you want to analyze TypeScript, you’ll also need to install the TS Plugin, you’ll find all the details here https://github.com/Pablissimo/SonarTsPlugin